The Tier 1 Problem: A Student Access Crisis
Littleton’s transformation began when two schools were placed into Targeted Support and Improvement (TSI) status due to low performance of the special education subgroup:
Students with disabilities…
● Were performing 30-40 percentage points below state expectations
● Proficiency rates were as low as 4.13% in ELA and 4.43% in math
Littleton identified the major root cause; Students with disabilities were consistently missing Tier 1 instruction due to fragmented scheduling practices.
Before DMSchedules:
● Students were often pulled from core instruction even when alternative intervention blocks existed
● Scheduling decisions were siloed and inconsistent across schools
● District leaders lacked real-time visibility into service delivery and compliance
● Issue was not just compliance, but also instruction access
● SPED providers scheduled pull-outs based on provider availability
A critical question was raised: Are we scheduling based on what students need… or what is easiest for adults? This “adult convenience over student needs” theme became a turning point in the district’s approach.
The Solution: DMSchedules as a System, Not a Tool
Littleton adopted DMSchedules districtwide to create a consistent scheduling structure that protects Tier 1 instruction and ensures equitable SPED service delivery.
Rather than relying on manual fixes, leaders implemented a system that made scheduling transparent, measurable, and collaborative.
Protecting Tier 1 instruction:
A major breakthrough came when Littleton redesigned master schedules to include:
● Protected Tier 1 literacy and math blocks
● Clearly defined intervention windows (“WIN” periods)
● Shared schedules accessible across teams
Additionally, Littleton created a common operating system for scheduling, helping teams move from reactive scheduling adjustments to proactive planning.
Operational Efficiency and Resource Savings:
Once scheduling data became visible, the district could finally answer questions that directly impact staffing costs:
● Who has capacity?
● Are providers maximizing group size?
● Are services being delivered efficiently (1:1 vs small group)?
● Do we need more staff - or do we need better scheduling?
Exhibit 1: Learning Environment Report outlines how much time students are spending in Gen Ed, Inclusion, and Pull out
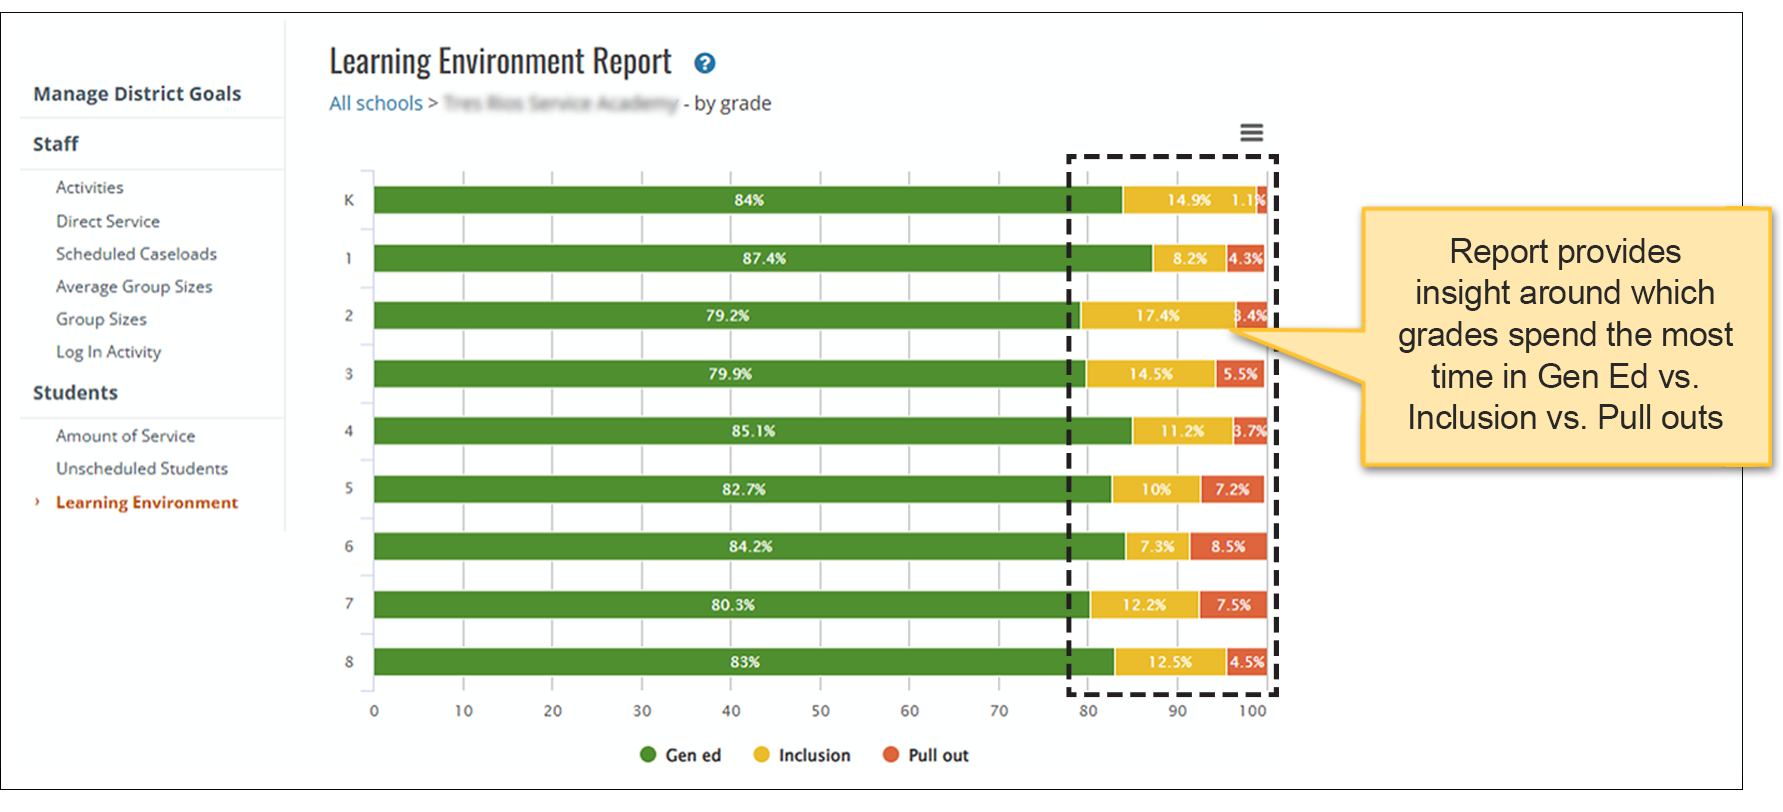
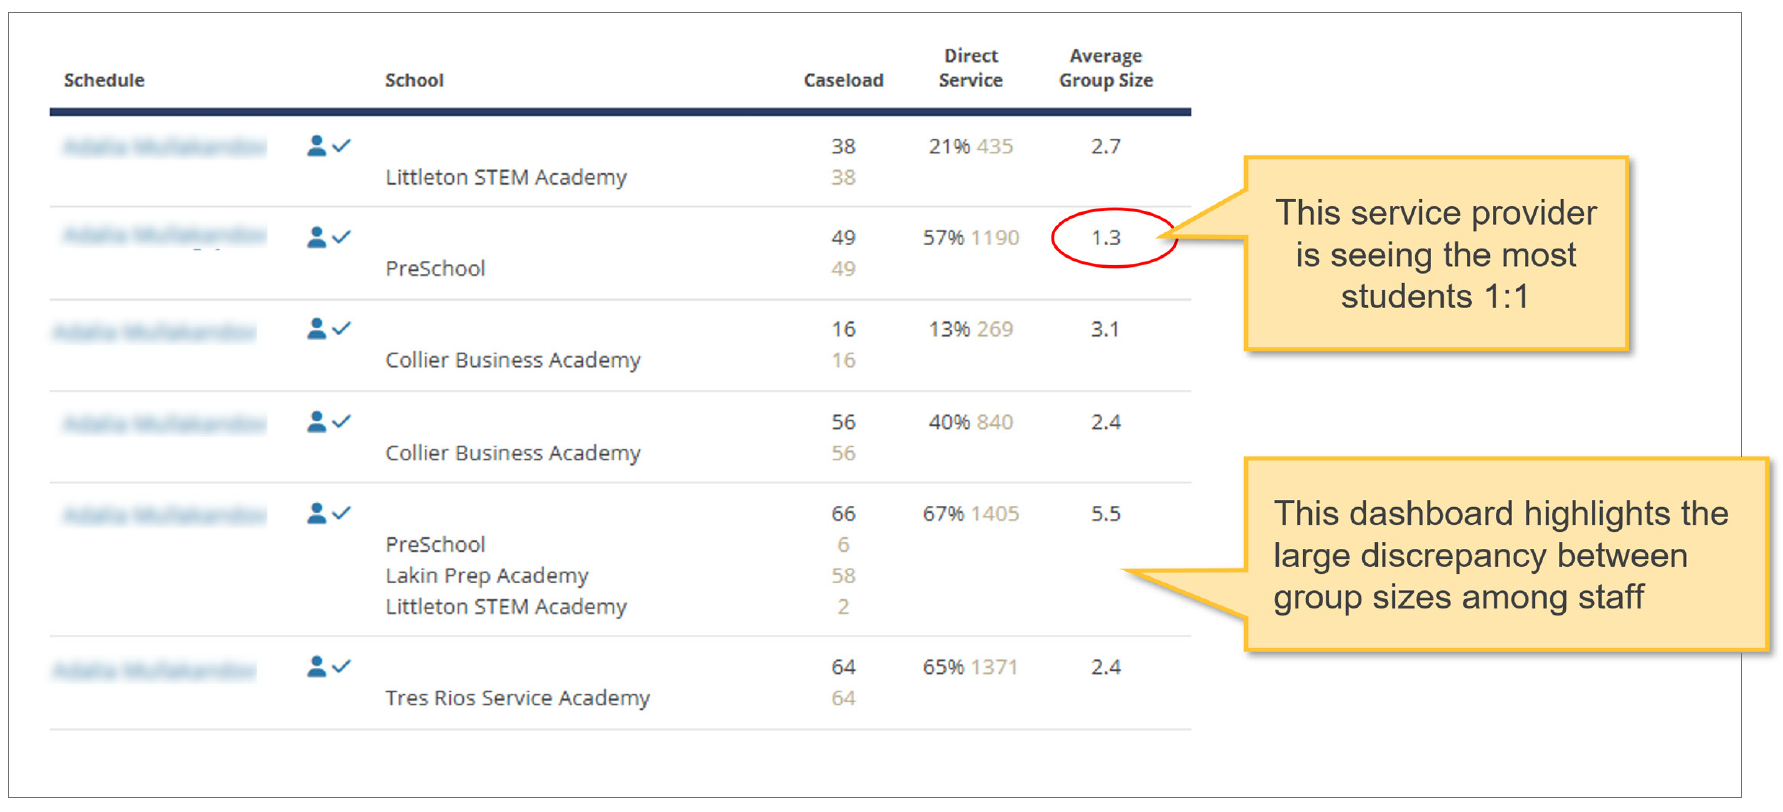
Exhibit 2: Staff summary report shows each educator’s caseload, % of direct service, and average study group size
Impact:
● Leaders could identify underutilized capacity
● Caseload decisions became equity-driven, not just “student count” based
● Contracted services could be used more strategically
● Scheduling became a lever for cost control, not just compliance
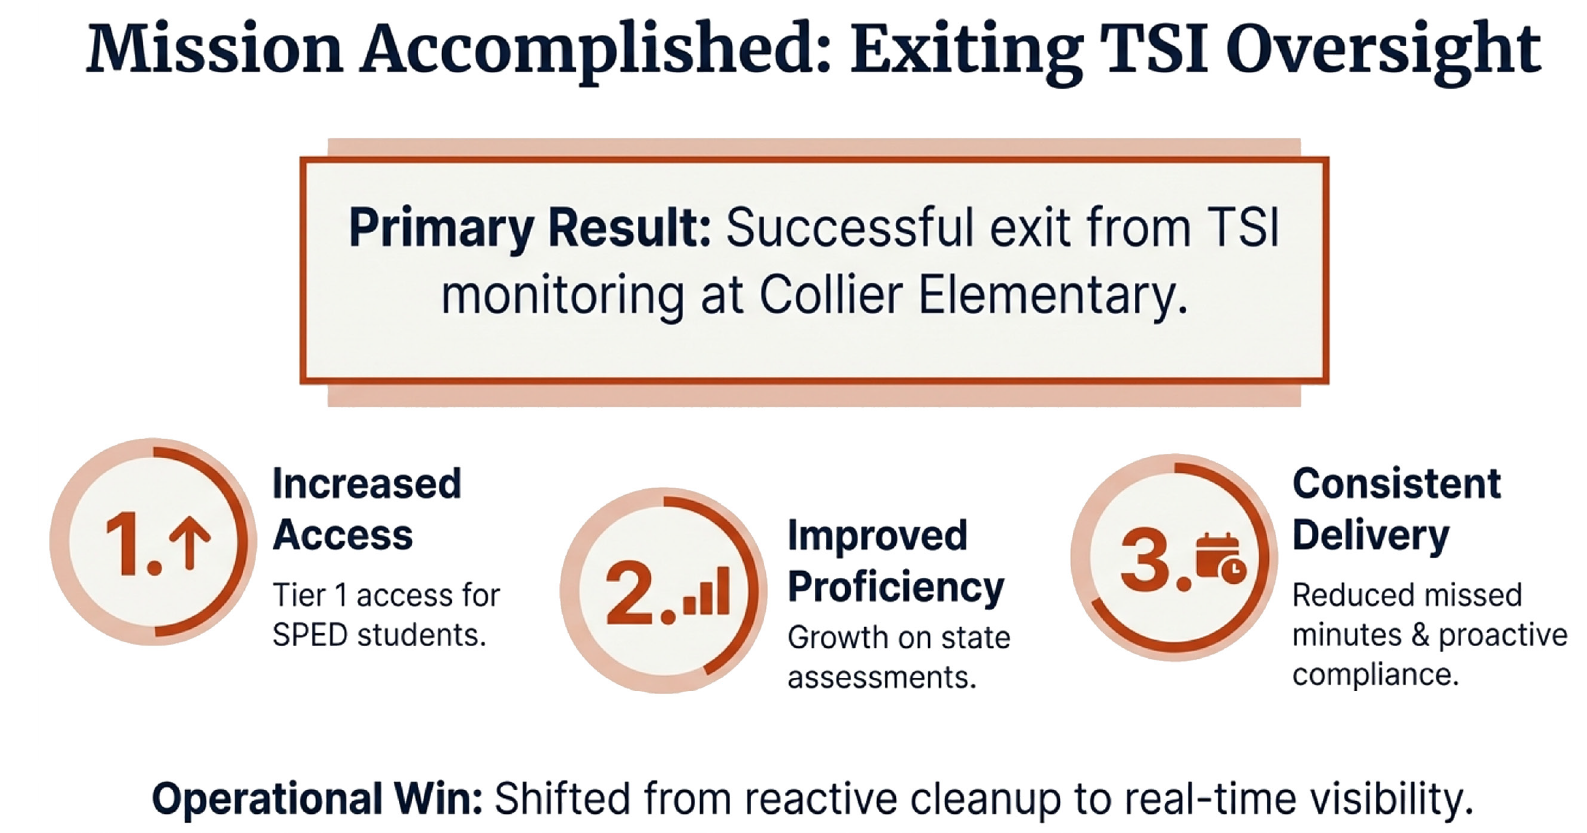
Results: